Dual Active Bridge: How the DAB Moves Power Between Two DC Systems
Published · 15 min read
On this page
Suppose we have a DC bus on one side and a battery on the other. We want to transfer power between them, provide electrical isolation, and allow the direction of transfer to reverse.
A transformer cannot work directly from a steady DC voltage. We need switching stages around it. The dual active bridge, or DAB, uses an actively controlled bridge on each side of a high-frequency transformer. The timing of their switching voltages determines the current and the average transferred power. 1, 2
The interesting question is how this happens. If both bridges produce square waves, what makes power move from one side to the other? And why does moving one waveform slightly in time change the result?
I find it useful to start with the voltage across the inductor, then follow the current. The power equation becomes much easier to understand after that.
1. What is inside the converter?
This article considers the basic single-phase, full-bridge DAB: two H-bridges, eight controlled switches, a high-frequency transformer, a transfer inductance, and DC-link capacitors. “Single-phase” here describes the converter’s high-frequency bridge arrangement; it does not specify the number of phases in an upstream AC grid.
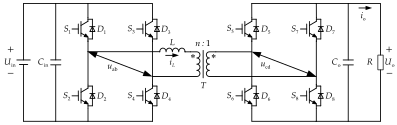
Each part has a specific job:
| Part | What it does |
|---|---|
| First active bridge | Produces a controlled high-frequency alternating voltage from the first DC port |
| Second active bridge | Produces another controlled alternating voltage at the second port and supports bidirectional operation |
| Transformer | Provides galvanic isolation and a turns ratio between the ports |
| Transfer inductance | Limits the rate of current change and participates directly in power transfer |
| DC-link capacitors | Buffer switching-frequency current at the DC ports |
The transfer inductance can include transformer leakage inductance and an additional external inductor. Leakage inductance is therefore part of the design, rather than only a parasitic quantity to minimize. Its value affects both the current waveform and the power that a given phase shift transfers. 1, 2
The reproduced circuit has a resistor at the output because its source paper studies output-voltage regulation. To sustain reverse power transfer, that port must have a source of energy, such as a battery or an energized DC bus. A passive resistor cannot supply continuous power back to the first port.
2. The voltage difference is the starting point
Let the DC voltages be \(V_1\) and \(V_2\), and define the transformer ratio as
\[n=\frac{N_1}{N_2}, \qquad V'_2=nV_2.\]The prime means that the secondary voltage has been referred to the primary side. The transfer inductance \(L\) and current \(i_L\) will also be expressed on the primary side throughout this article.
Let \(u_1(t)\) be the first bridge’s alternating voltage and \(u'_2(t)\) the referred second-bridge voltage. Ignoring losses and magnetizing current for this initial explanation,
\[L\frac{di_L}{dt}=u_1(t)-u'_2(t).\]This equation tells us the slope of the current. A positive voltage difference makes the current rise; a negative difference makes it fall. A zero difference makes it remain constant in this ideal model. 1, 3
Notice what is being shifted in time: the alternating bridge voltages. The steady DC-bus voltages themselves do not “lead” or “lag” one another.
Also, always check a paper’s turns-ratio definition. Some authors use \(N_2/N_1\) instead. Copying an equation without translating that convention can put the transformer ratio on the wrong side.
3. What do the gate pulses do?
Start with single-phase-shift modulation, usually called SPS. Each bridge generates a bipolar square wave with an ideal 50% duty ratio. One diagonal pair is commanded during one half-cycle, and the other pair during the next.
Using the numbering in Figure 1:
- S1 and S4 command the primary bridge’s positive voltage; S2 and S3 command its negative voltage.
- S5 and S8 command the secondary bridge’s positive voltage; S6 and S7 command its negative voltage.
- A phase displacement between the two bridge waveforms controls the transfer.
Real gate commands include dead time between complementary switches in a leg. This prevents the upper and lower switches from being commanded on simultaneously, which would short the DC link. The ideal timing explanation below leaves out that short commutation interval. 1, 2
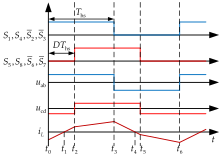
To follow one complete switching cycle, define \(\theta=\omega_s t\) and let the primary bridge lead by \(\phi\), with \(0\leq\phi\leq\pi\). The ideal voltage states are:
| Interval | Primary voltage | Referred secondary voltage | Voltage across \(L\) |
|---|---|---|---|
| \(0\leq\theta<\phi\) | \(+V_1\) | \(-V'_2\) | \(V_1+V'_2\) |
| \(\phi\leq\theta<\pi\) | \(+V_1\) | \(+V'_2\) | \(V_1-V'_2\) |
| \(\pi\leq\theta<\pi+\phi\) | \(-V_1\) | \(+V'_2\) | \(-V_1-V'_2\) |
| \(\pi+\phi\leq\theta<2\pi\) | \(-V_1\) | \(-V'_2\) | \(-V_1+V'_2\) |
The current is piecewise linear because each interval applies a constant ideal voltage to the inductance. If \(V_1=V'_2\), the same-polarity intervals have zero slope. If the referred voltages differ, those sections slope as well. The published waveform in Figure 2 shows the latter behavior. 1, 3
A gate command is not the whole current path
An inductor current cannot jump to a different value when the gate commands change. It continues through the available semiconductor paths.
For example, when the primary bridge commands a positive voltage, the current may initially still be negative. With the transistor-and-diode symbols used in Figure 1, that current can flow through D1 and D4, returning energy toward the first DC port. After the current crosses zero, S1 and S4 carry the positive-direction current. In a MOSFET implementation, reverse conduction can also use a gated channel. During dead time, device capacitances and diodes participate in commutation. 2, 3
This is why the gate diagram, current polarity, and device type must be considered together. A drawing of the commanded switch pairs alone does not describe every conduction interval.
4. How does phase shift determine power?
Define positive \(\phi\) to mean that \(u_1\) leads \(u'_2\). Under the ideal SPS conditions above, positive average power flows from port 1 to port 2. Reversing the lead reverses the average transfer.
The average input power is obtained by integrating the product of bridge voltage and current over a switching period. For periodic, balanced SPS operation, this gives
\[P_{1\rightarrow2} = \frac{V_1V'_2}{\omega_s L} \phi\left(1-\frac{|\phi|}{\pi}\right), \qquad \omega_s=2\pi f_s.\]| Here \(\phi\) is in radians, and the expression applies for $$ | \phi | \leq\pi$$. It assumes fixed DC voltages, ideal 50% bridge square waves, and neglects losses, dead time and magnetizing current. 1, 3 |
| The usual monotonic control branch is $$ | \phi | \leq\pi/2$$. Beyond that point, increasing the magnitude of the phase shift no longer increases the ideal transferred power. The peak ideal magnitude is |
That expression is not a complete hardware power rating. Semiconductor current, cooling, magnetics, insulation and switching conditions still impose limits.
There is also a notation trap. Wang and colleagues use a normalized delay \(D=\phi/\pi\), measured against half a switching period. Other sources normalize against the full period. A value called “phase shift = 0.2” is incomplete unless its normalization is stated.
A numerical example
Take an illustrative ideal operating point:
| Quantity | Value |
|---|---|
| Primary DC voltage \(V_1\) | 400 V |
| Referred secondary DC voltage \(V'_2\) | 400 V |
| Switching frequency \(f_s\) | 100 kHz |
| Primary-referred transfer inductance \(L\) | 40 μH |
| Primary-leading phase shift \(\phi\) | 30°, or \(\pi/6\) radians |
The switching period is 10 μs, so the time displacement is
\[\Delta t=\frac{\phi}{2\pi f_s}\approx0.833\ \mu\mathrm{s}.\]Substituting into the power expression gives approximately 2.78 kW from port 1 to port 2. Changing the phase shift to −30° gives approximately −2.78 kW under the same assumptions.
During the opposite-polarity interval, 800 V appears across 40 μH, so the current slope is 20 A/μs. For the symmetric periodic solution, the current rises from approximately −8.33 A to +8.33 A during the 0.833 μs interval. It then has a flat section because the referred DC voltages are equal.
The resulting ideal inductor RMS current is approximately 7.86 A, while average input DC current is about 6.94 A. These are different quantities; the winding and semiconductor conduction losses cannot be assessed from average DC current alone.
These values are analytical calculations for this example, checked by integrating the switching intervals. They are not experimental results from the cited papers, and Figure 2 is not the exact waveform of this matched-voltage example.
5. Why is a DAB useful in EV charging?
A charger supplied from AC typically needs an AC–DC stage and a DC–DC stage. A DAB can serve as the isolated DC–DC stage between the DC bus and the battery.
The transformer provides isolation and a useful voltage ratio. The bridges allow controlled power transfer in either direction, while the controller regulates battery current or voltage according to the charging strategy and system limits. A changing battery voltage makes the operating range especially important: a converter that performs well at one voltage and load may behave differently elsewhere. 4, 6
There are concrete implementations to study. Kuo and colleagues investigated TPS operation with a 15 kW battery-charger prototype. Texas Instruments provides the 10 kW, 100 kHz TIDA-010054 DAB reference design. These are examples with specific devices, magnetics and operating conditions, rather than universal specifications for a DAB. 4, 6
A bidirectional DAB does not, by itself, create a complete vehicle-to-grid system. The upstream converter, protection, communications and system controls must also support the requested direction and mode of operation.
Other applications include battery energy storage, DC microgrids, and isolated conversion stages in solid-state transformers. The same topology can appear in these systems, but its voltage range, isolation requirements and control objectives need to follow the application. 1, 2
6. What problems appear in practice?
The topology looks symmetrical and the SPS equation is compact. That can hide how much of the engineering is contained in the operating conditions.
Zero-voltage switching is conditional
DAB converters can achieve zero-voltage switching, or ZVS, when the current has the appropriate direction and enough energy is available to charge and discharge device capacitances during commutation.
That condition is not automatically satisfied at every load and voltage ratio. Light-load operation and a large mismatch between \(V_1\) and \(V'_2\) can reduce the available soft-switching region. 2, 4
Circulating current can cost power without delivering much
The current can reverse within a cycle even when average power flows in one direction. Voltage mismatch can also produce AC current at zero phase shift, despite zero ideal average transferred power.
This current still contributes to winding and semiconductor losses. Reducing RMS current is therefore an important design objective. However, some current may help the commutation needed for ZVS, so the lowest-current solution and the widest-ZVS solution need not be the same. 2, 4
Magnetics and transients matter
The transformer needs appropriate insulation, core and winding design, and thermal performance. Increasing switching frequency can reduce magnetic-component size, while also changing core, winding and switching losses.
Steady-state symmetry is not enough by itself. Startup, a sudden phase-command change, timing errors or unbalanced volt-seconds can introduce current offsets and flux imbalance. The controller and switching sequence must handle these transitions, not only the final operating point. 2, 5, 6
Real measurements and switching are not ideal
Dead time, sensor noise, digital delay, parasitic capacitance and the physical layout affect the actual behavior. Fast switching also creates electromagnetic-interference challenges.
A controller may improve regulation while leaving excessive current stress or poor switching conditions elsewhere. The voltage response is one part of the evaluation; current, losses, temperature and protection behavior belong in it as well. 1, 2, 6
7. Modulation and feedback control are different decisions
The literature uses many names, so I want to separate two questions.
Modulation: how are the bridge switching waveforms arranged?
Feedback control: how are the commands calculated from measurements and references?
SPS, EPS, DPS and TPS describe modulation choices. PI, model-predictive control and sliding-mode approaches describe feedback or estimation methods. A feedback controller can be combined with more than one modulation scheme. 5
Common modulation choices
| Scheme | Main degree of freedom | Why consider it? |
|---|---|---|
| SPS — Single Phase Shift | One external phase shift between bridge voltages | A simple starting point with a relatively straightforward power relation |
| EPS — Extended Phase Shift | External phase shift plus an internal shift in one bridge | Adds waveform flexibility, including a zero-voltage interval |
| DPS — Dual Phase Shift | Two independent shifts; a common form links the internal shifts of the bridges and also varies the external shift | Gives more freedom to manage current and switching conditions |
| TPS — Triple Phase Shift | Independent internal shifts in both bridges plus the external shift | Supports broader optimization, with more operating cases and implementation complexity |
Definitions, especially those of DPS and normalized phase variables, must be checked in each paper. More control variables give more choices; they do not guarantee a better result unless the objective and constraints are chosen well. 4, 5
Common feedback approaches
A PI controller is a practical baseline for a voltage or current loop. It compares the measured variable with a reference and adjusts the command. Its tuning must account for converter dynamics, operating range, command limits and digital delay.
Model-predictive control (MPC) predicts the effect of possible commands and chooses one according to an objective. It can address dynamic behavior and constraints, but its result depends on the model, measurements, computation and timing.
Sliding-mode and disturbance-observer methods seek robustness against disturbances or model mismatch. Their benefits depend on the estimator or control design, gain selection, noise behavior and implementation. 1, 5
One published example is the observer-assisted MPC in the following figure.
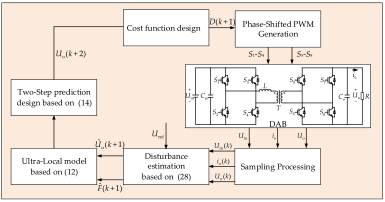
The method uses an ultra-local model, estimates disturbances, and applies a two-step prediction before selecting a phase-shift command. The authors evaluated it experimentally on their DAB platform. This makes it a useful study of parameter sensitivity and dynamic response, rather than a controller that every DAB must use. 1
8. How would I start a design or read a DAB paper?
Before choosing an advanced controller, I would make the operating envelope explicit: minimum and maximum port voltages, continuous and transient power, transfer direction, isolation needs, and switching frequency.
Then I would examine the turns ratio and transfer inductance across that envelope. A single nominal operating point can conceal high RMS current, hard switching, or insufficient power capability at another point.
The next step is to calculate current waveforms and estimate semiconductor and magnetic losses, followed by checking thermal limits, startup and protection. Turzyński and colleagues provide an example of an analytical loss model compared with measurements on a 5 kW SiC DAB prototype. 2
When reading a control paper, I ask what was actually tested: which voltage ratios, which load steps, which parameter changes, and which measurements? A faster output-voltage response in one experiment does not establish better efficiency or lower current stress over the whole application.
Useful research questions follow directly from these tradeoffs: efficient operation across a wider battery-voltage range; reduced RMS current while retaining soft switching; better transient current and flux behavior; and controllers that remain effective with delay and parameter variation. The cited TPS, loss-model and observer-MPC studies address different parts of that problem. 1, 2, 4
For me, the useful first question remains the one at the beginning: what voltage is across the inductance during this interval, and what does it make the current do? Once that is clear, the phase shift, power direction and control choices become much easier to examine.
References and figure sources
- S. Wang, F. Yu and J. Qi (2025). “Model Predictive Voltage Control Strategy for Dual Active Bridge Converters Based on Super-Twisting Integral Sliding Mode Observer.” Electronics, 14(8), 1496. Paper and DOI. Source of all three reproduced figures; original figure numbers 1, 2 and 5. Open access under CC BY 4.0.
- M. Turzyński et al. (2022). “Analytical Estimation of Power Losses in a Dual Active Bridge Converter Controlled with a Single-Phase Shift Switching Scheme.” Energies, 15(21), 8262. Paper and DOI. Analytical loss model and experimental comparison using a 5 kW prototype.
- P. Guzmán et al. (2021). “Two-Stage Modulation Study for DAB Converter.” Electronics, 10(21), 2561. Paper and DOI. Switching intervals, current-waveform analysis and modulation.
- S.-h. Kuo et al. (2024). “High Efficiency Dual-Active-Bridge Converter with Triple-Phase-Shift Control for Battery Charger of Electric Vehicles.” Energies, 17(2), 354. Paper and DOI. TPS analysis and a 15 kW charger prototype.
- J. He et al. (2023). “Review of Modeling, Modulation, and Control Strategies for the Dual-Active-Bridge DC/DC Converter.” Energies, 16(18), 6646. Review and DOI. A review for comparing terminology and following the primary literature.
- Texas Instruments — TIDA-010054. Bidirectional dual-active-bridge reference design for level 3 EV charging stations. Manufacturer documentation and design files for a specific 10 kW implementation.
Sources checked on 3 November 2026. The numerical example is an ideal calculation, not a hardware design specification or a reported experiment.